Article
Published
Articles and Reading materials
These are Articles, presentations and other data science materials. That has encourage or helped me in my data analytics and data science journey, experience from what have learnt, use in my career or inspired by.
I have published several articles on Medium, wordpress website, and on LinkedIn,.
This is the link Meium and these are example of my original code in python: fruits = ["apple", "banana", "cherry"]
for x in fruits:
print(x).
Finally, some of my personal projects and codes are hosted on a GitHub public domain GitHub.
Published papers
Financial analysis of poultry production in Kwara State, Nigeria.
Abstract : This study examined the economics of poultry production in Kwara State, Nigeria using budgetary and profit index analysis. Primary data were collected through a set of structured questionnaire from 80 registered poultry farmers using a systematic random sampling technique. The results of the study showed that 72.5% of the respondents were youth with the mean age of 38.7 years and 63.8% choose poultry farming as main occupation. Analysis of costs and returns revealed that poultry production is profitable in the study area. The gross income and net income for eggs production were found to be Naira 4,062,422 and Naira 1,255,965, respectively, while the gross and net incomes for broilers production were Naira 1,683,209 and Naira 499,187, respectively. The regression analysis showed that stock capacity, variable, and fixed costs including labour, feed, and equipment were the significant factors affecting poultry farm business in the study area. These costs increase as the size of the business increases. To achieve optimum output and maximise profit, poultry producers in the study area would have to stem down cost of production. Provision of technical education through extension agents would greatly help in achieving this lofty goal.
full projectThe effect of sustainable land management technologies on farming household food security in Kwara state, Nigeria
Nigeria is among countries of the world confronted with the food insecurity problem. The agricultural production systems that produce food for the teeming population are not sustainable. Consequently, the use of Sustainable Land Management (SLM) technologies becomes a viable option. This study assessed the effect of SLM technologies on farming households’ food security in Kwara State, Nigeria. A random sampling technique was used to pick 200 farming households for this study. The analytical tools included descriptive statistics, Shriar index, Likert scale, food security index and logistic regression analysis. The results indicated that the average age of the respondents was 51.8 years. The food security index showed that the proportions of food secure and insecure households were 35% and 65% respectively. The binary logistic regression revealed that SLM technologies were one of the critical determinants of food security. An increase in the usage of SLM technologies by 0.106% raised food security by 1%. Other important factors that were estimated included farm income, family size, gender and age of the household head. To reduce the effects of food insecurity, the effective coping strategies adopted by the respondents were reduction in quantity and quality of food consumed, engaging in off-farm jobs to increase household income and using of money proposed for other purposes to buy foods. Governments at all levels should encourage the adoption and use of SLM technologies through both print and electronic media. Policies and strategies towards reducing the household size should be vigorously pursued to reduce food insecurity. Keywords: agricultural practices, coping strategies, farming households, food security, SLM technologies and logistic regression.
full projectLists
My Articles
- Published papers.
- posted articles.
- project explanations.
- projects images.
posted articles
- Assumptions of Linear Regression
-
- Linear relationship
- Multivariate normality
- No Auto-correlation
- No multicollinearity
- Homoscedasticity
1. We assume the relationship between the target and the features is truly linear; there is a constant change in target given a unit change in a feature. continue Reading - Salaries of a data science in Nigeria
-
Data science! This role has become one of the most important and promising roles, especially in the IT and technical line. A data scientist basically works with raw data using various tools and algorithms to solve critical data analytic problems. Data science is one career that has long been foreseen as one that will trend in the future because of its impact on our daily lives. Some top career and professional websites like Glassdoor.com and Careercast.com rated data science as the No.1 best job in America for 2016. Many persons have become interested in building a successful career in data science as a result of recent trends.
continue Reading - Overfitting and underfitting of ML model
-
One of the most commonly asked questions during data science interviews is about overfitting and underfitting. A recruiter will probably bring up the topic, asking you to define the terms and explain how to deal with them. In this article, we’ll address this issue…
continue Reading
quote
“Without big data analytics, companies are blind and deaf, wandering out onto the web like deer on a freeway.” – By Geoffrey Moore.
Feed back
Hope you enjoyed your time with my articles. Please drop your Feedback below.courses taking and certificates
Images


Create a Dashboard using Dash & Flask in Python!
Introduction
 Dash is an open-source web framework for creating analytical dashboards and data visualizations. It helps data analysts to deploy dashboards and serve these dashboards to the main web application. Dash constitutes of three technologies:
Setting up the local environment:
Let us start with making a new directory and create a python virtual environment in it. Open the command prompt and make a new directory named as PracticeDashboard using the following command.
c:> mkdir PracticeDashboard && cd PracticeDashboard
c:>PracticeDashboard python -m venv venv
c:>PracticeDashboard venvScriptsactivate.bat
The above commands first create a Practice Dashboard directory and then creates a virtual environment at that location. The last command activates the virtual environment.
Virtual environment
A virtual environment is a python environment such that a python interpreter, scripts, and libraries are installed in it. These libraries are isolated from any other libraries installed in them. This is beneficial as any version changes in the system don’t hamper the virtual environment and hence several virtual environments can work separately without any hindrance. Therefore it is important to create a separate virtual environment and activate the same.
After the virtual environment is activated, now install the required libraries.
(venv)$ python -m pip install dash==1.13.3 pandas==1.0.5
Dataset
We will get a dataset. we can simply download the dataset and save the CSV file in the folder PracticeDashboard. The folder looks like this:PracticeDashboard
|
|-----venv
|----indexData.csvBuilding the Dashboard
The first step is to initialize the dash application. Create an empty file app.py in the project directory. Copy the code given below:
#This library is used to initialize the dash application.
import dash
# This library is used to add graphs,other visual components.
import dash_core_components as dcc
# This library is used to include html tags.
import dash_html_components as html
#For data manipulation and mathematical operations.
import pandas as pd
#Reading the csv file.
data = pd.read_csv("indexData.csv")
#Manipulating the date.
data["Date"] = pd.to_datetime(data["Date"], format="%Y-%m-%d")
data.sort_values("Date", inplace=True)
#Initialising application.
app = dash.Dash(__name__)
The next step is to define the layout of the application using dcc components. We will use the app.layout property.
Finally, the following two-line will help the application to run:
if __name__ == "__main__":
app.run_server(debug=True)
Now open the console and go to the project directory and run the command as follows:
python app.py
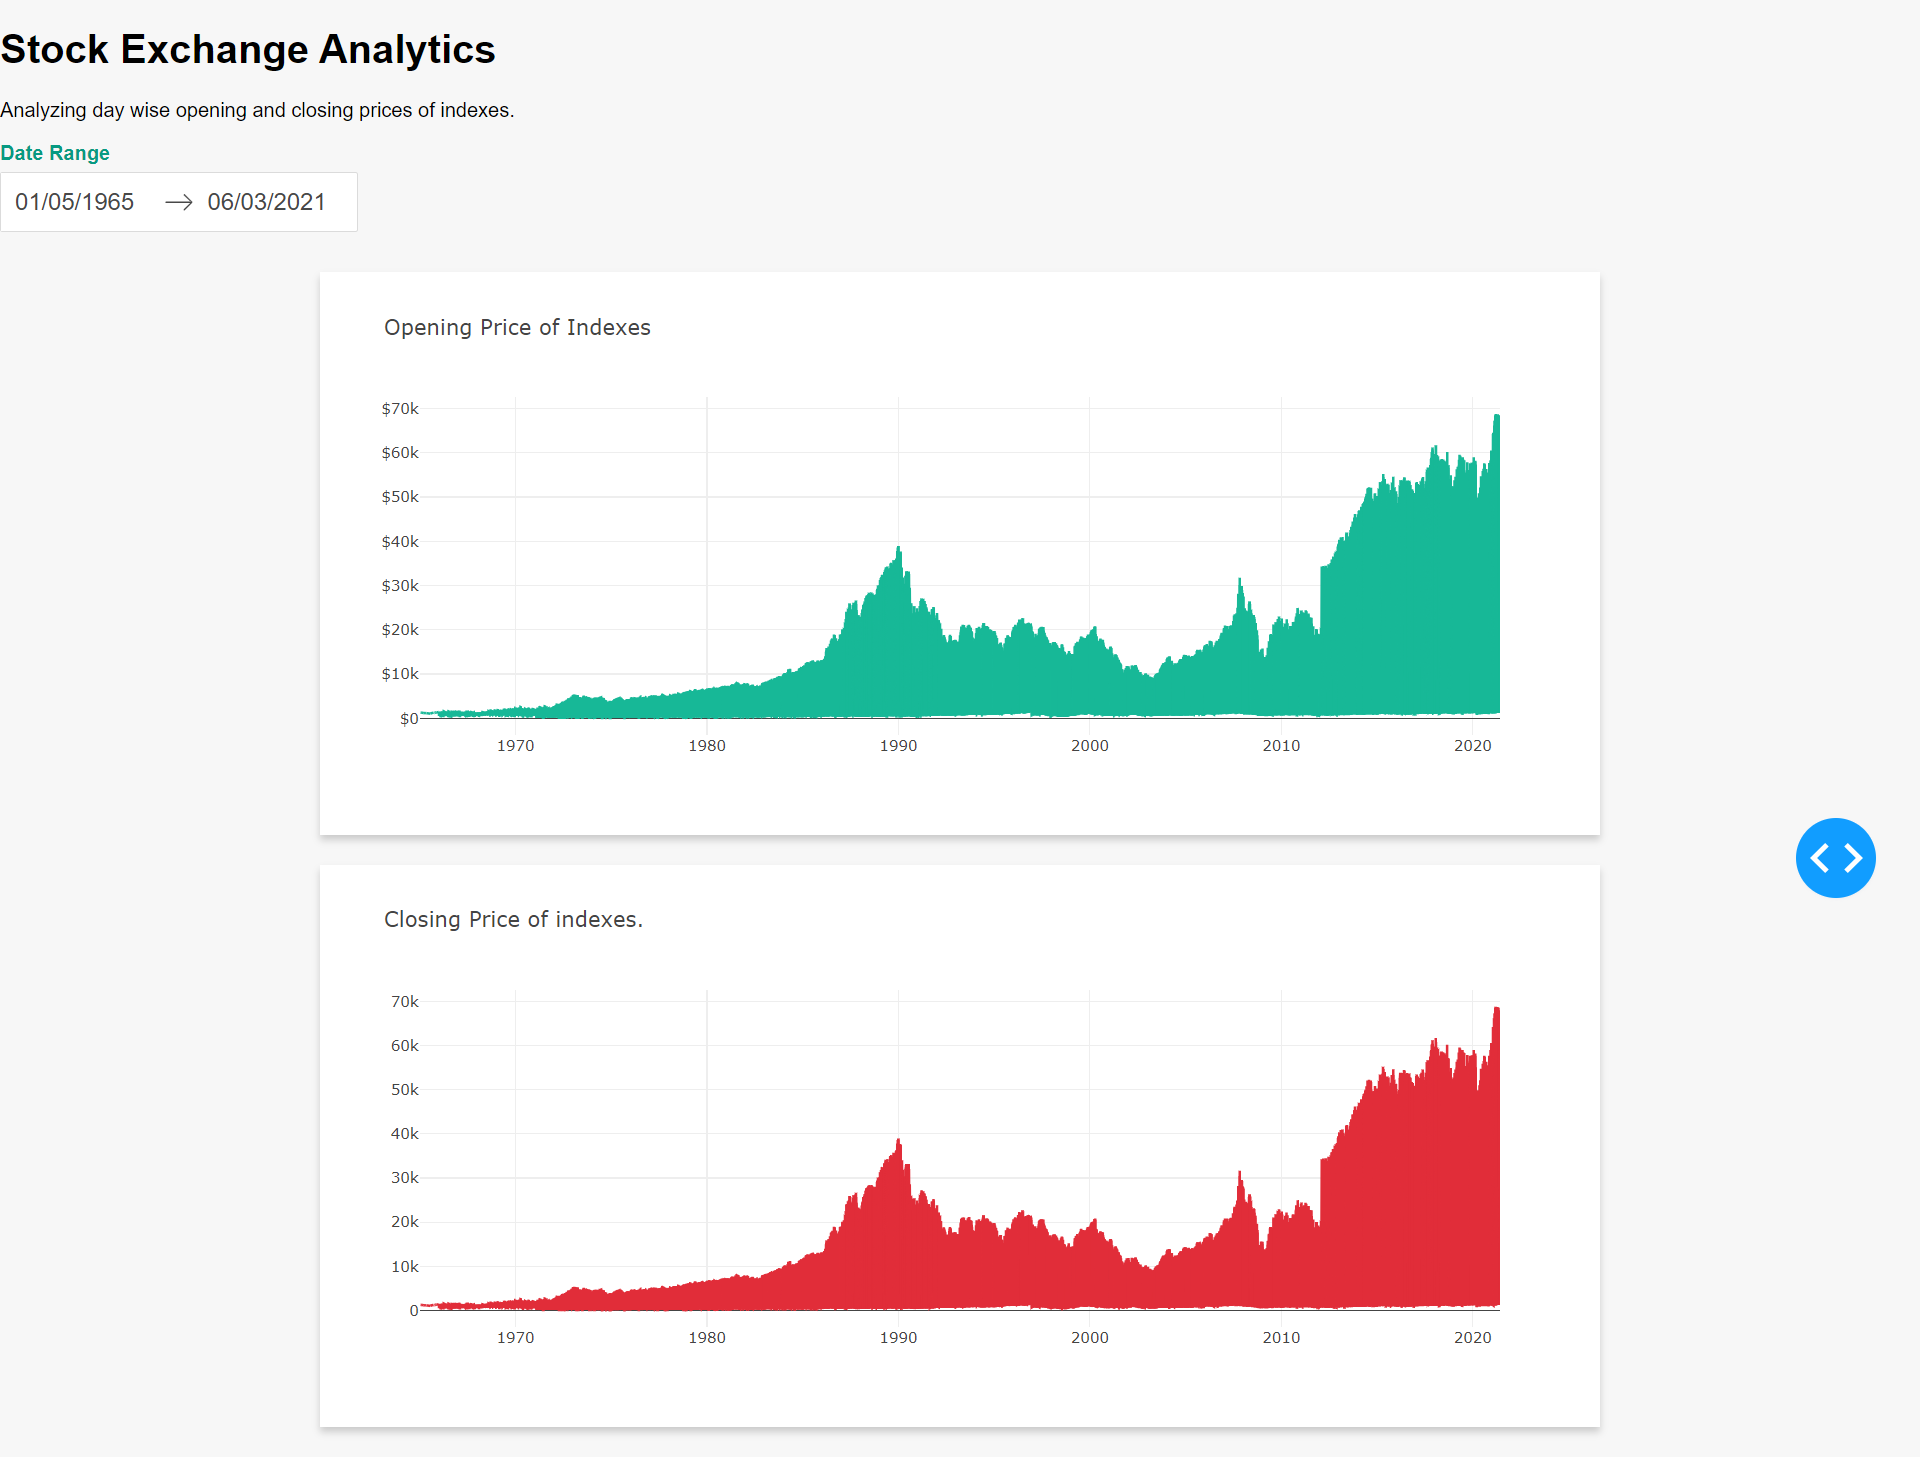
Making the dashboard interactive:
To make the dashboard interactive we will add a date range picker so that the graph automatically changes with the range of the dates. We will add an Html date picker to select the dates range on the top. So app.layout gets changed to the following:
app.layout = html.Div(
    children=[
        html.H1(children="Stock Exchange Analytics",),
        html.P(
            children="Analyzing day wise opening and closing prices of indexes.",
        ),
        html.Div(
            children=[
                html.Div(
                    children="Date Range",
                    className="menu-title"
                    ),
                dcc.DatePickerRange(
                    id="date-range",
                    min_date_allowed=data.Date.min().date(),
                    max_date_allowed=data.Date.max().date(),
                    start_date=data.Date.min().date(),
                    end_date=data.Date.max().date(),
                ),
            ]
        ),
The dcc component for the graph gets changed from the previous version of the dashboard. The figure component is not required as the graph will be generated from the callback function. The changed code is shown below:
html.Div(
    children=[
        html.Div(
            children=dcc.Graph(
                id="open-price-chart", config={"displayModeBar": False},
            ),
            className="card",
        ),
        html.Div(
            children=dcc.Graph(
                id="close-price-chart", config={"displayModeBar": False},
            ),
            className="card",
        ),
    ],
    className="wrapper",
),
    ]
)
close_price_chart_figure = {
"data": [
{
"x": filtered_data["Date"],
"y": filtered_data["Close"],
"type": "lines",
},
],
"layout": {
"title": {
"text": "Closing Price of indexes.",
"x": 0.05,
"xanchor": "left"
},
"xaxis": {"fixedrange": True},
"yaxis": {"fixedrange": True},
"colorway": ["#E12D39"],
},
}
return open_price_chart_figure, close_price_chart_figure
Conclusion
Dash provides a fast and quick way of creating beautiful and interactive dashboards without extensive knowledge of web development. It combines web development and analytics and provides a useful mechanism for serving dashboards as a web response. Interactivity and styles can be easily incorporated into the dashboards as shown by the second version of the dashboard.